Being interested in urban planning and having an IT background, I have a strong interest in GIS. I have experience using ArcGIS Pro, ArcGIS Online, ArcMap, and QGIS. I also have experience working with Python and ArcPy. Here are some of my projects from my independent work/study:
Providence Crash Map
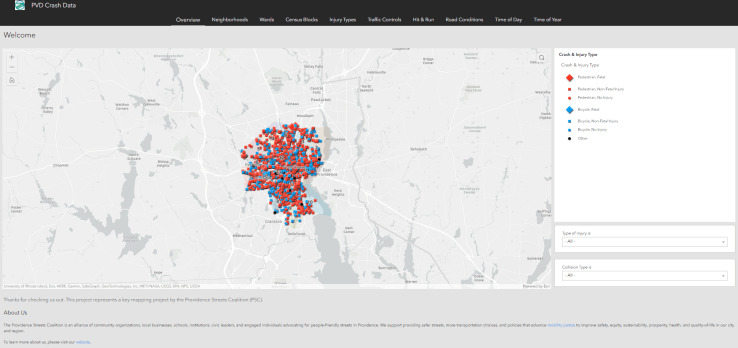
In 2023, I joined the Providence Streets Coalition (PSC) to assist with a mapping project. To raise awareness for street safety in the city of Providence, RI, USA, PSC worked with the Providence Police city police to gather data on traffic crashes and accidents from 2010 – 2022. I along with other members of PSC worked to develop an interactive web app that consists of analyses and visualizations that we made to help better understand and break down the nature of these traffic crashes and identify correlations. The goal of this project was to help inform the City of Providence and other community stakeholders of the concerning amount of traffic crashes such that community action can be made to improve street safety within the city.
I was primarily in charge of the data visualization aspects using ESRI tools. After several other PSC members finished their QA/geocoding of the data, I worked to analyze the data across several attributes and created an ESRI web app to visualize these ‘views’ into the data. This data is supplemented by some tableau visualizations created by another PSC member, to provide a comprehensive analysis. The web application is best viewed on laptops/desktops and can be viewed here.
Deforestation in Brazil
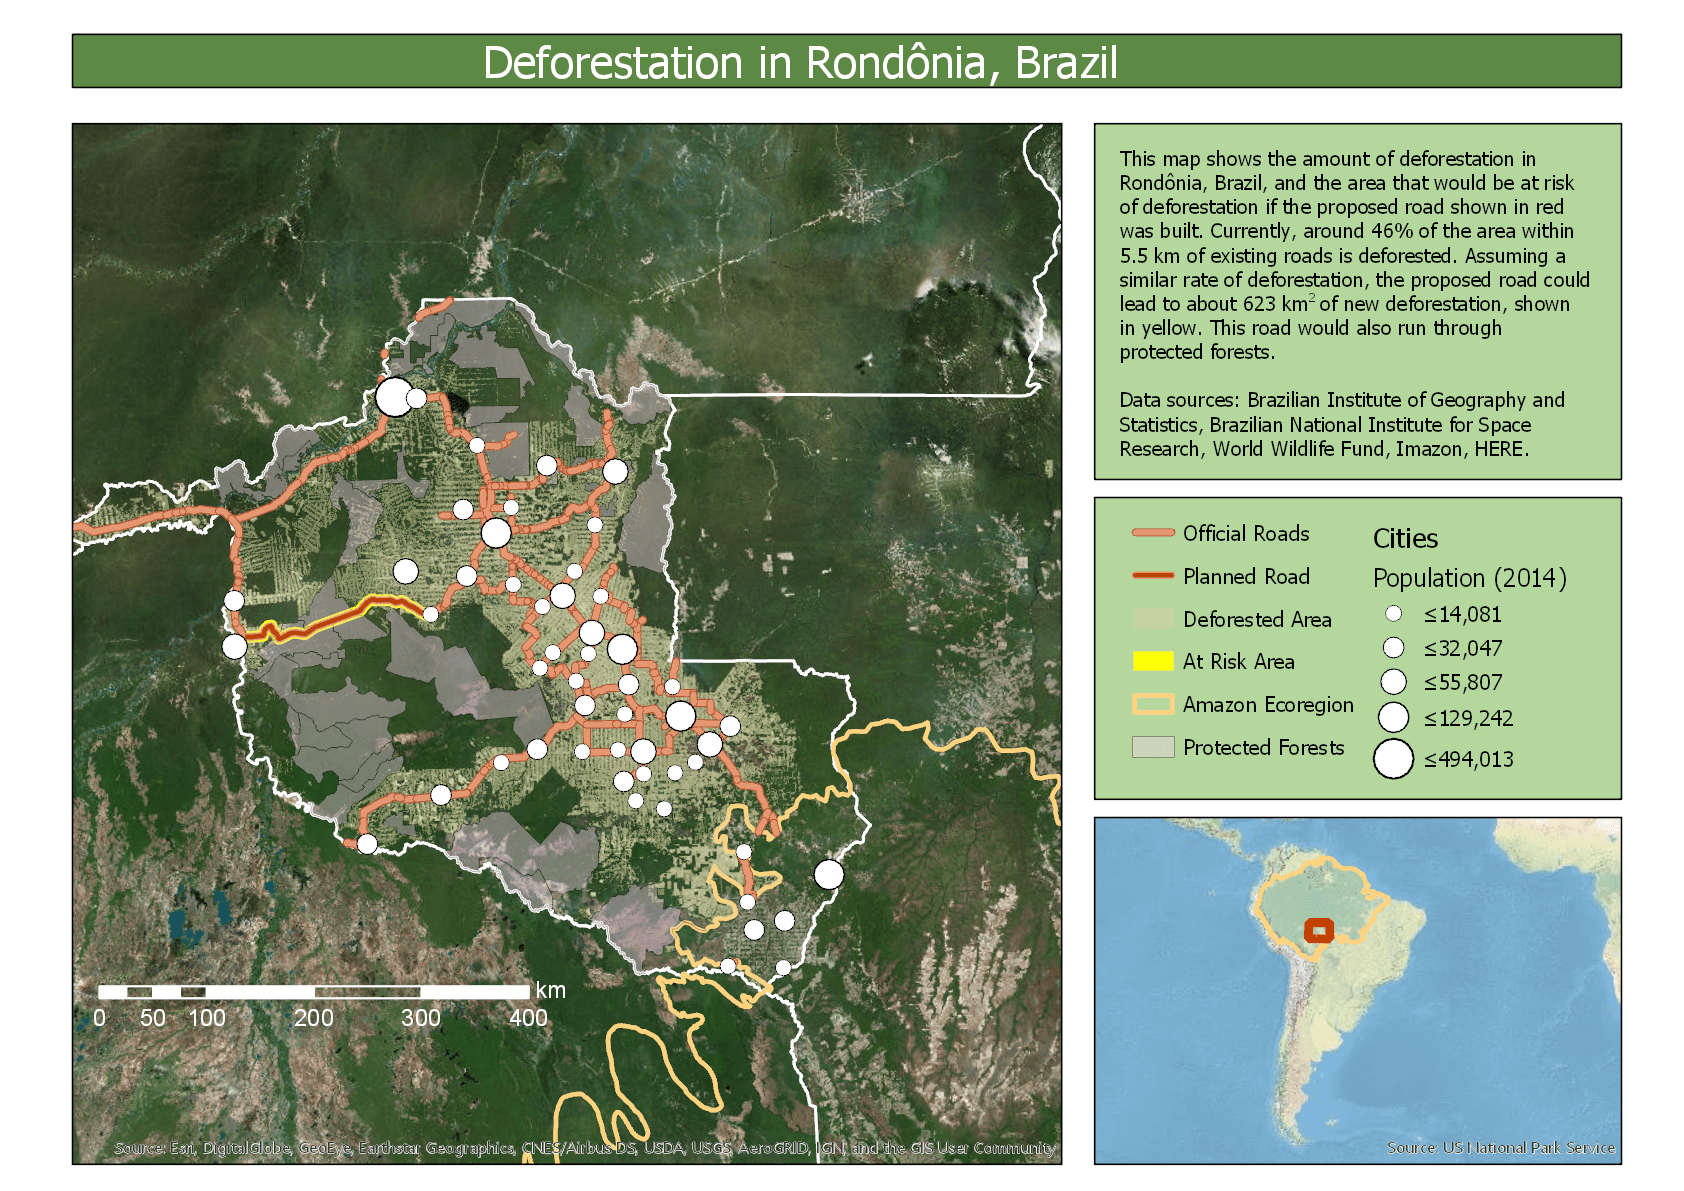
This is a project from an ArcGIS class I undertook. In the class, we calculated the estimated amount of new deforested land if the road shown below were to be built.
Flooding in Venice
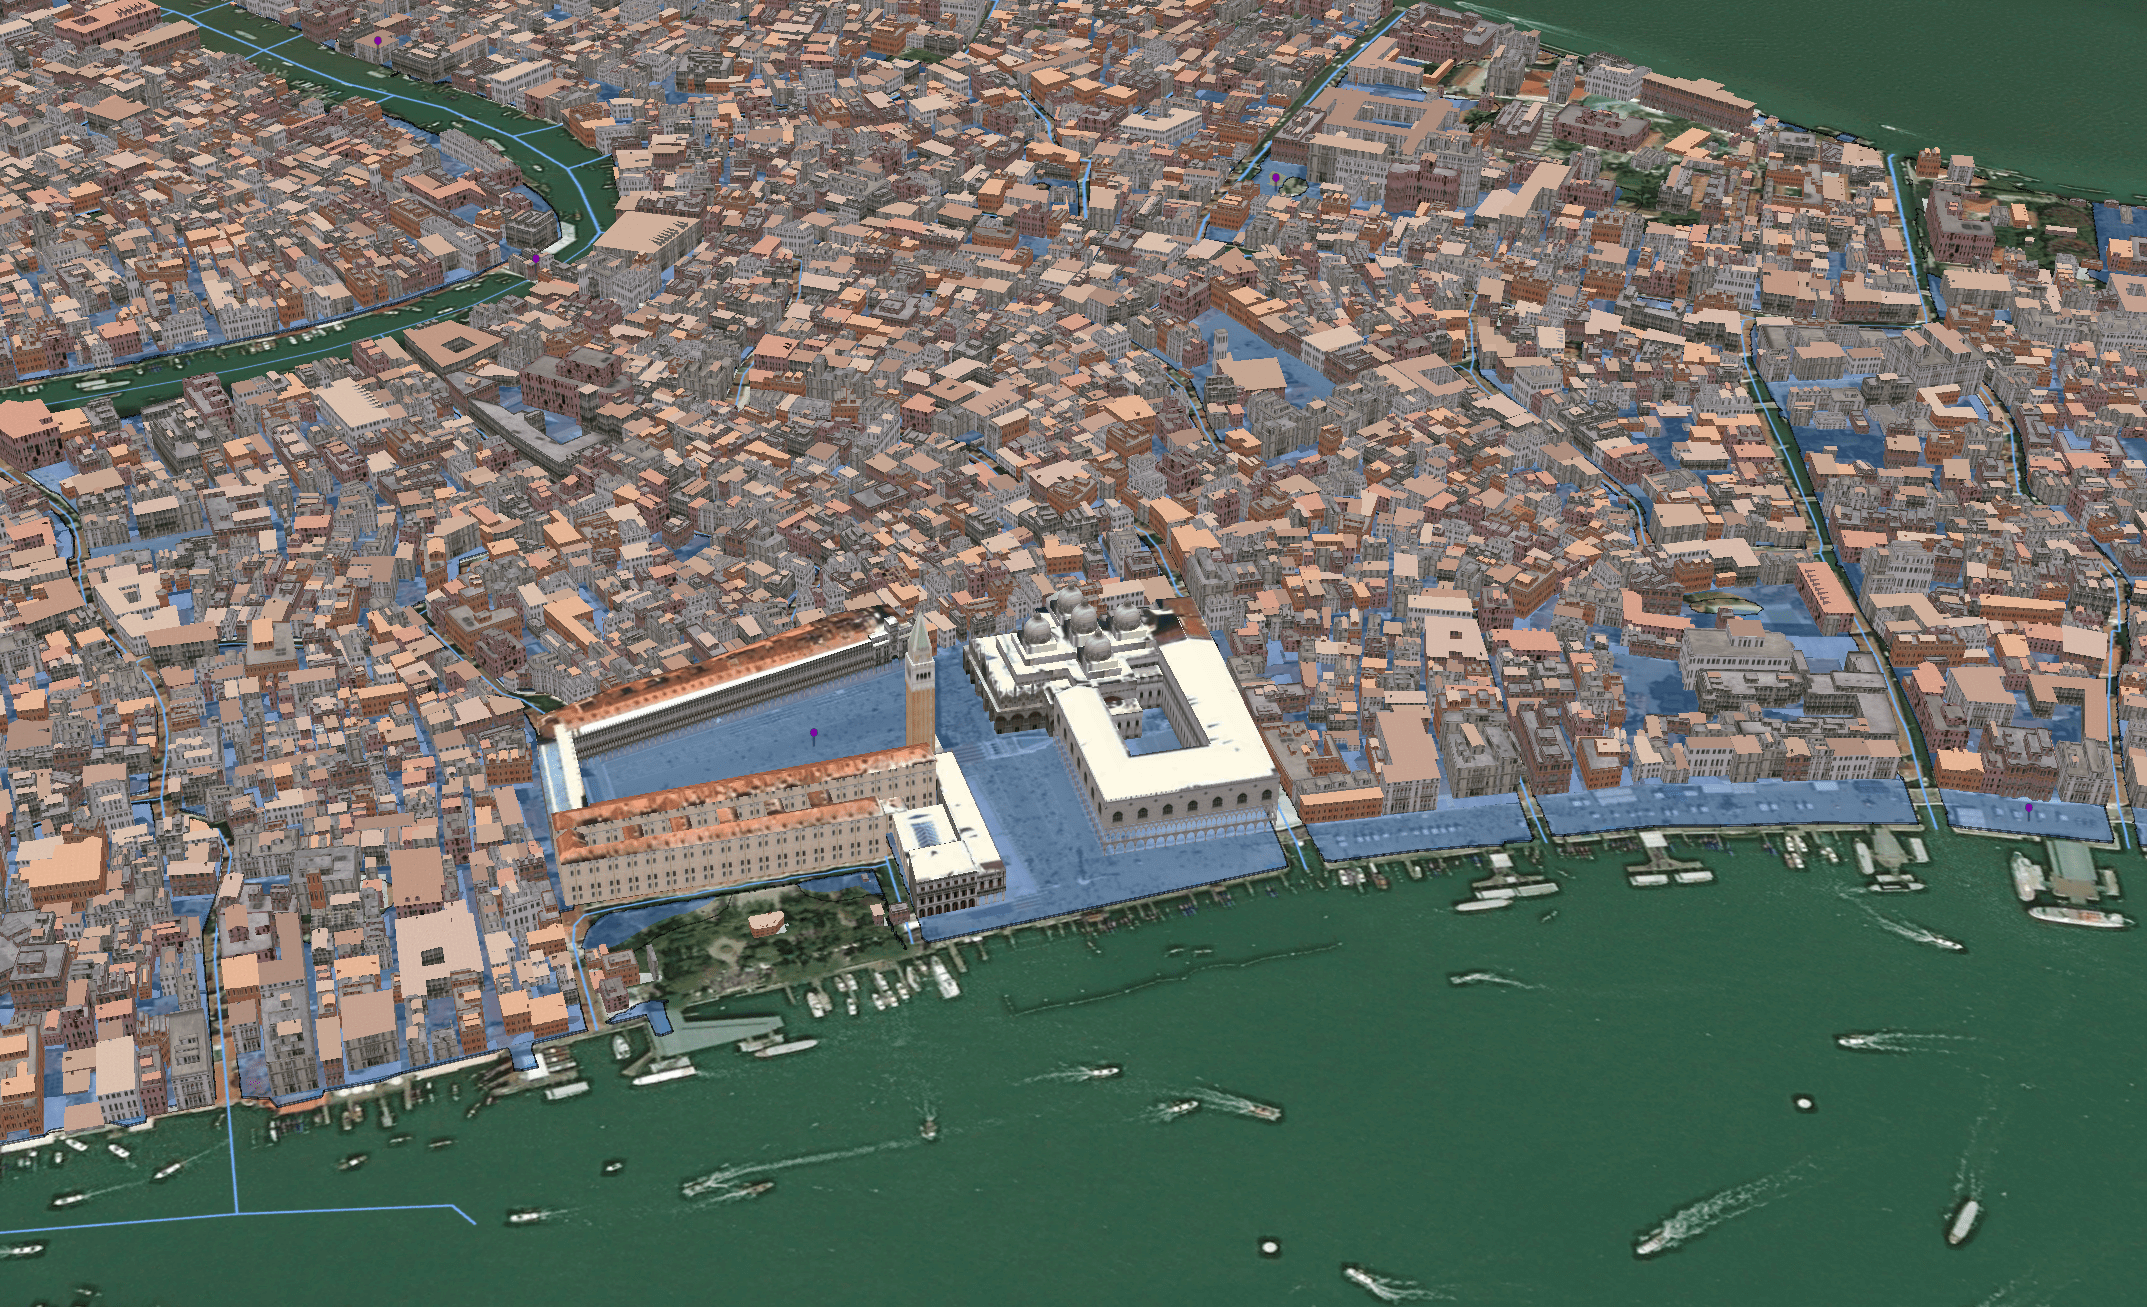
This is a project from a class where I calculated the perennial flood areas of Venice, Italy. This 3D map screenshot shows areas in blue that are the most at risk or are prone to flooding. Venice’s elevation is only 1 m, so even waters as low as 1.4 m can cause severe flooding.
Working Holiday Visa Planner
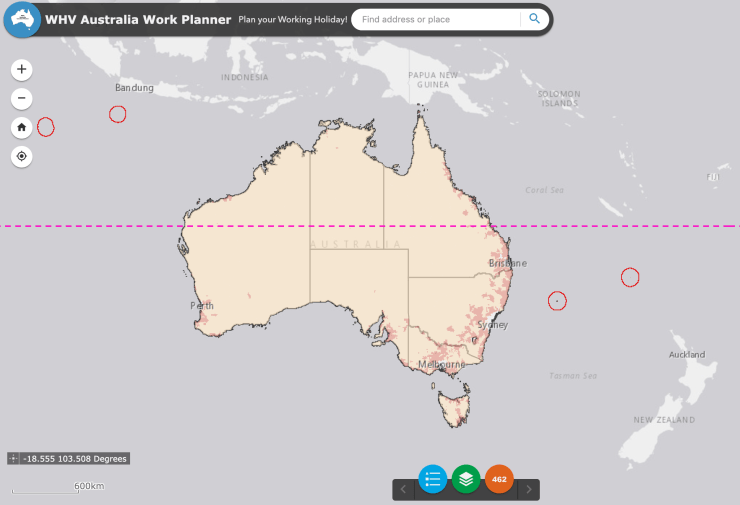
Below is a web app that I made that helps people plan their specified work for a Working Holiday in Australia. This application shows population density and eligible postcodes for specified work and contains an interactive filter to see what regions are eligible for each type of work:
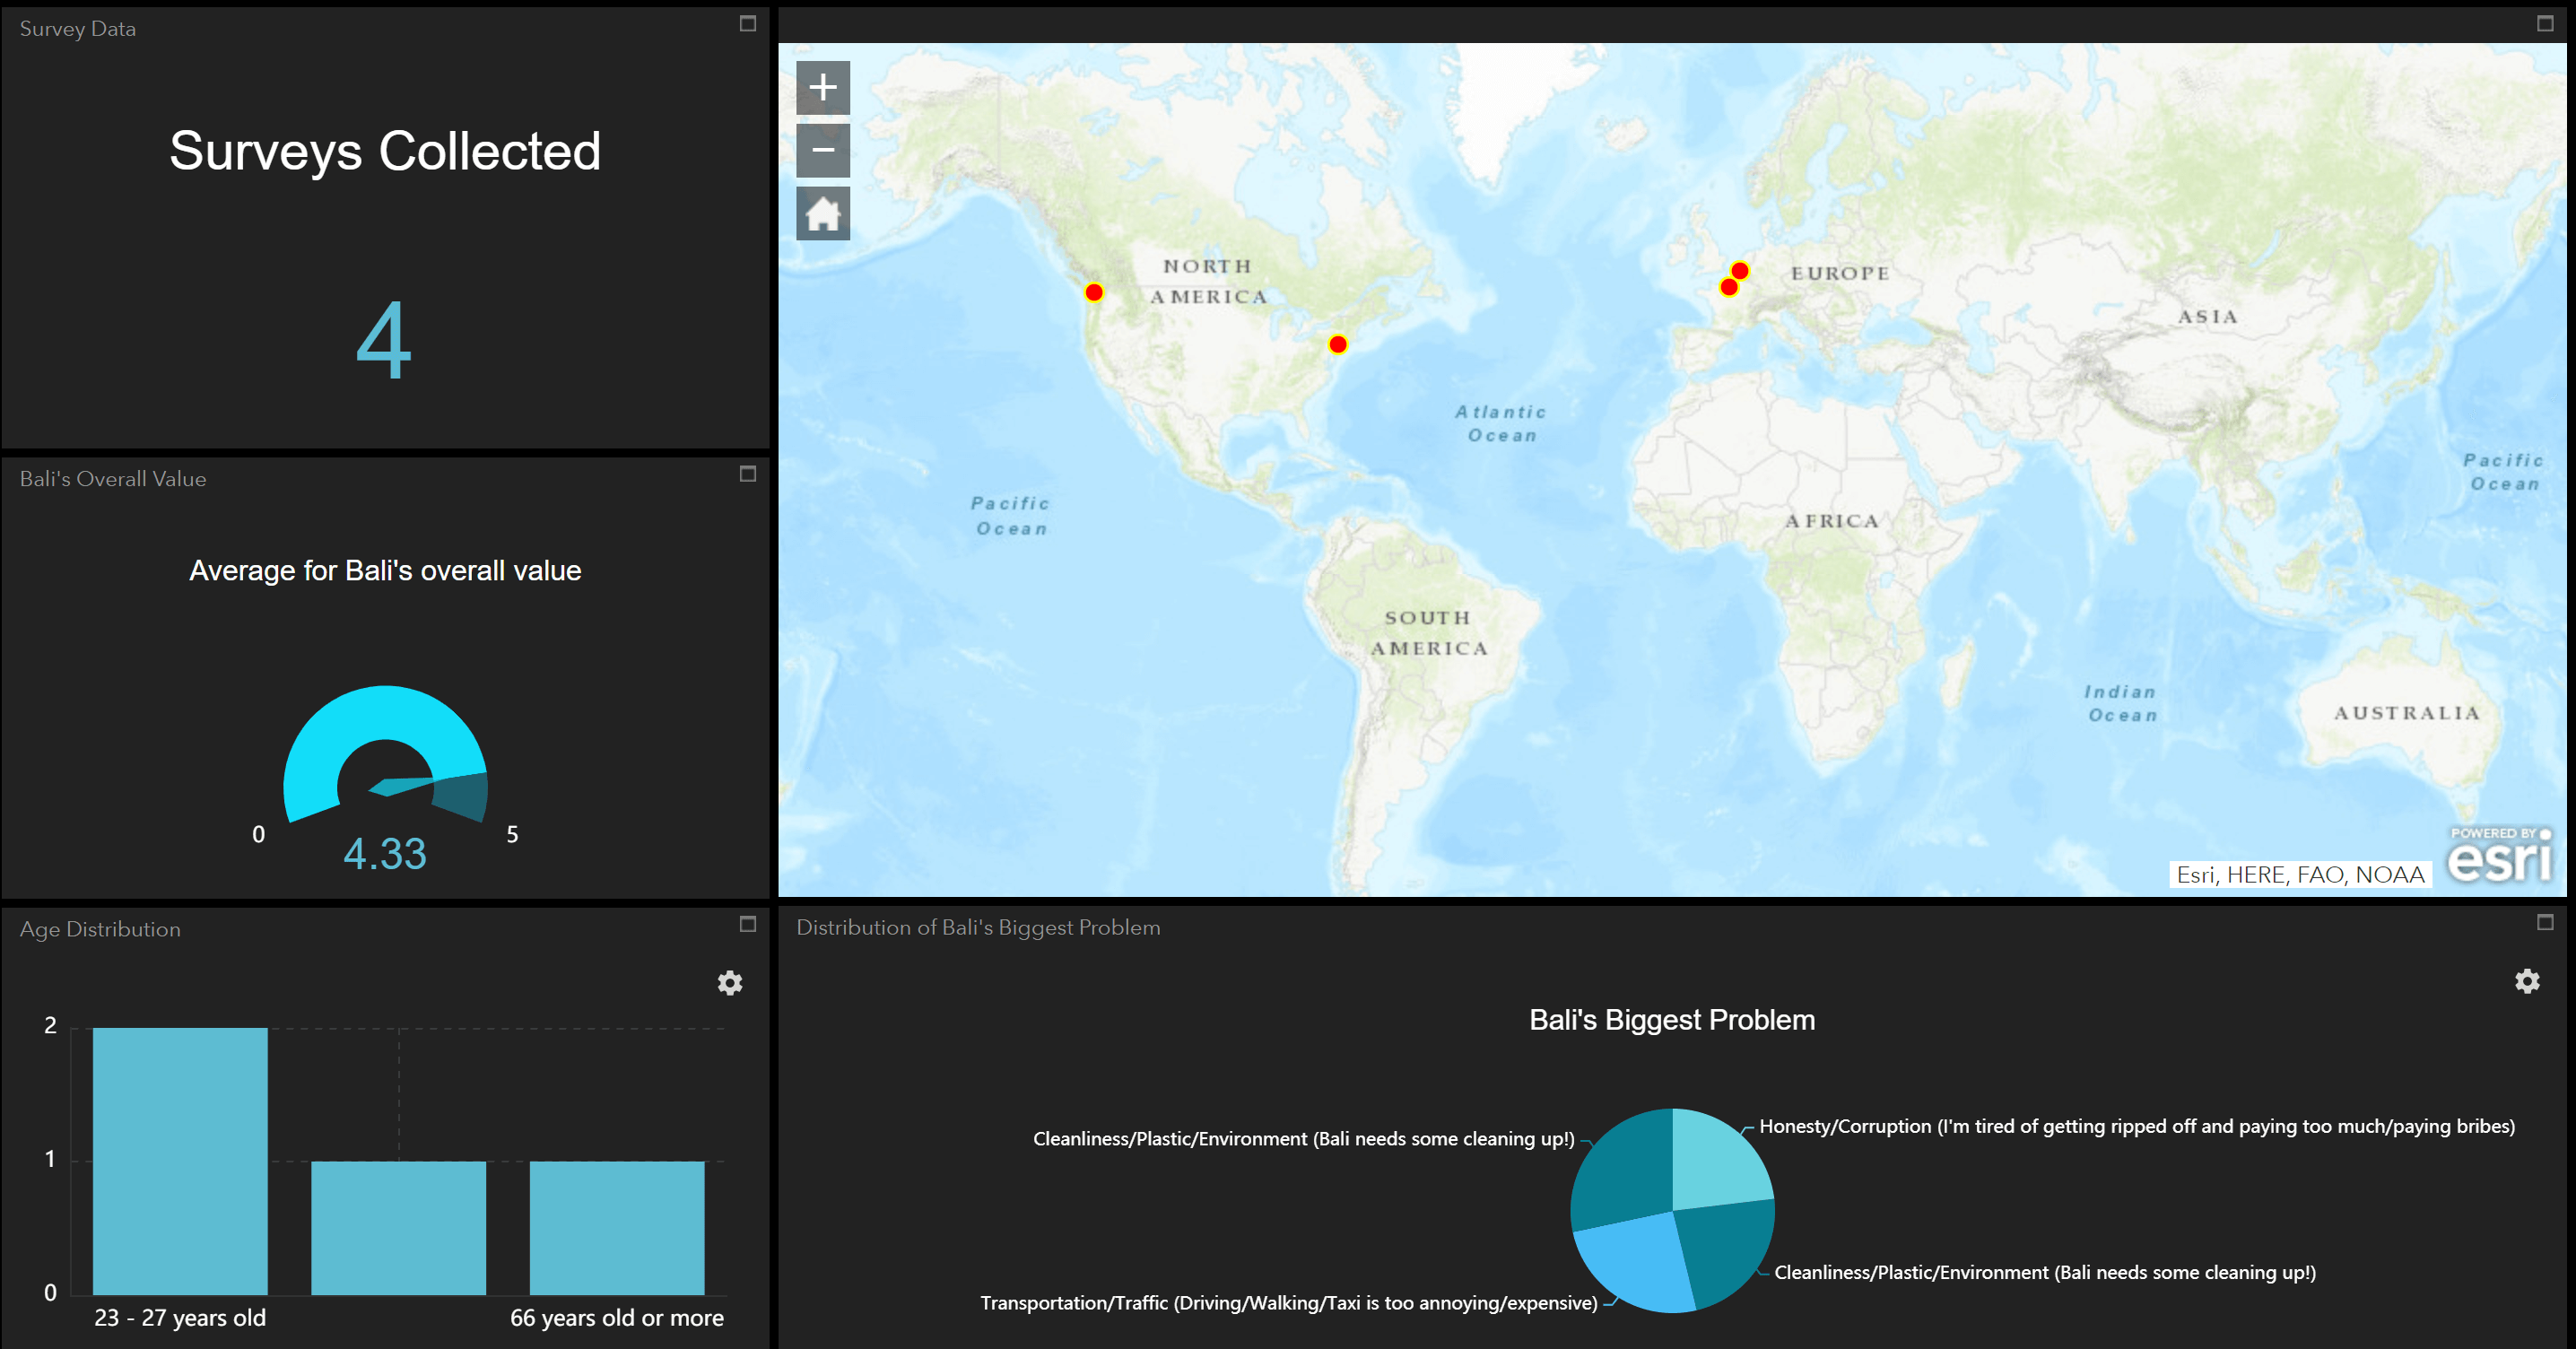
Bali Satisfaction Dashboard
This is an interactive dashboard that I made that shows the results from a Survey123 survey. The survey asked various questions about the opinions of visitors to Bali, Indonesia.
Melbourne Public Transit Coverage
This web app I made shows the extent of Melbourne’s public transportation coverage within the metropolitan area of Melbourne, Australia. The application can be configured to show 5 and 10-minute walk times to trams, trains, and buses.
Oso Mudslide Flyover
This video animation is a flyover I made that shows the environmental changes after a mudslide in Oso, Washington, USA. The columns show the locations of homes that existed before the mudslide.
To see my full ArcGIS Online portfolio, please click here.
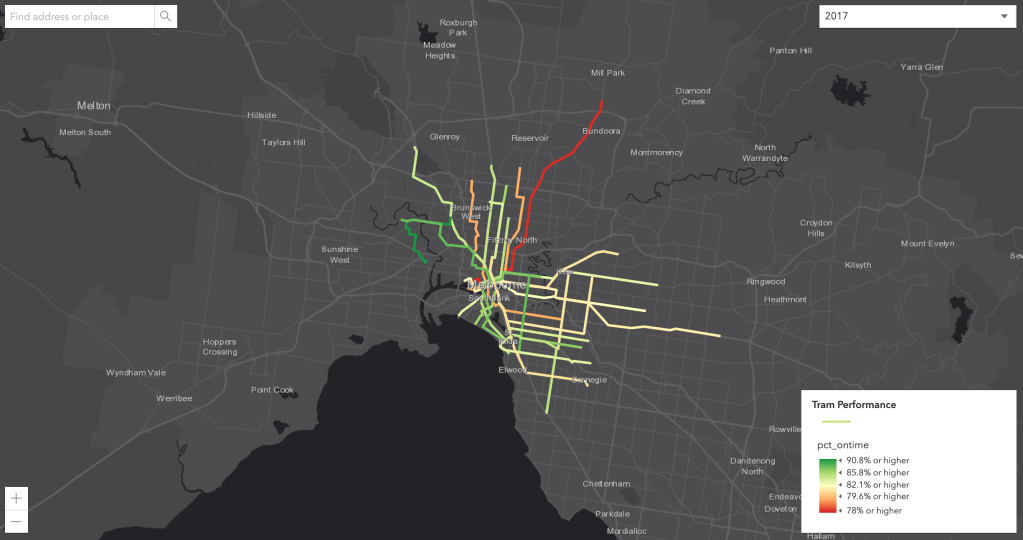
ArcGIS JavaScript API Tram Visualization
Below is an application I made using ArcGIS’s JavaScript API that shows the performance of the tram network in Melbourne Australia. Click the photo below to launch the app.
COVID-19 Web App
I made a web app that shows a live, up-to-date choropleth map for COVID-19 worldwide. The data is collected via a web scraper written in Python and then is pushed to a GeoJSON file where it is then displayed as a map. Click the image below to view the app. You can find the code on my GitHub.

