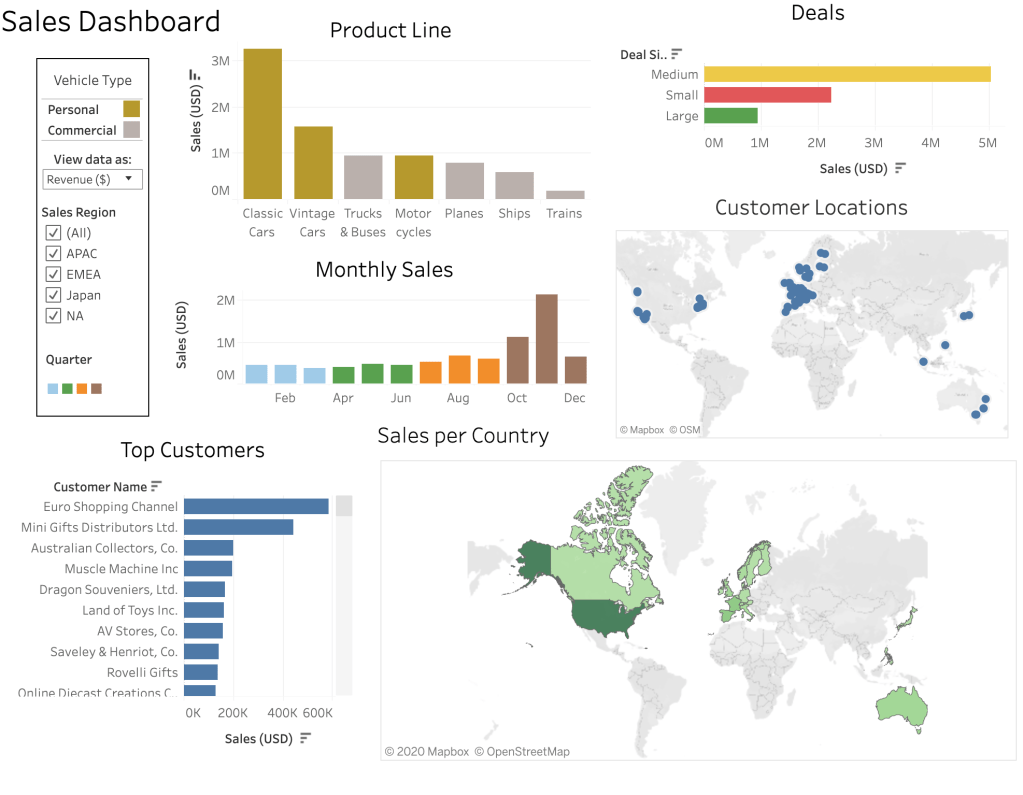
I have experience analysing/visualising data via Microsoft Excel and Tableau. Below is an interactive Sales Dashboard that I made in Tableau:
I also completed the KPMG Virtual Internship, where I performed an analysis for a bicycle company to help them determine who their ideal customer was. Below is the final presentation I gave to them:
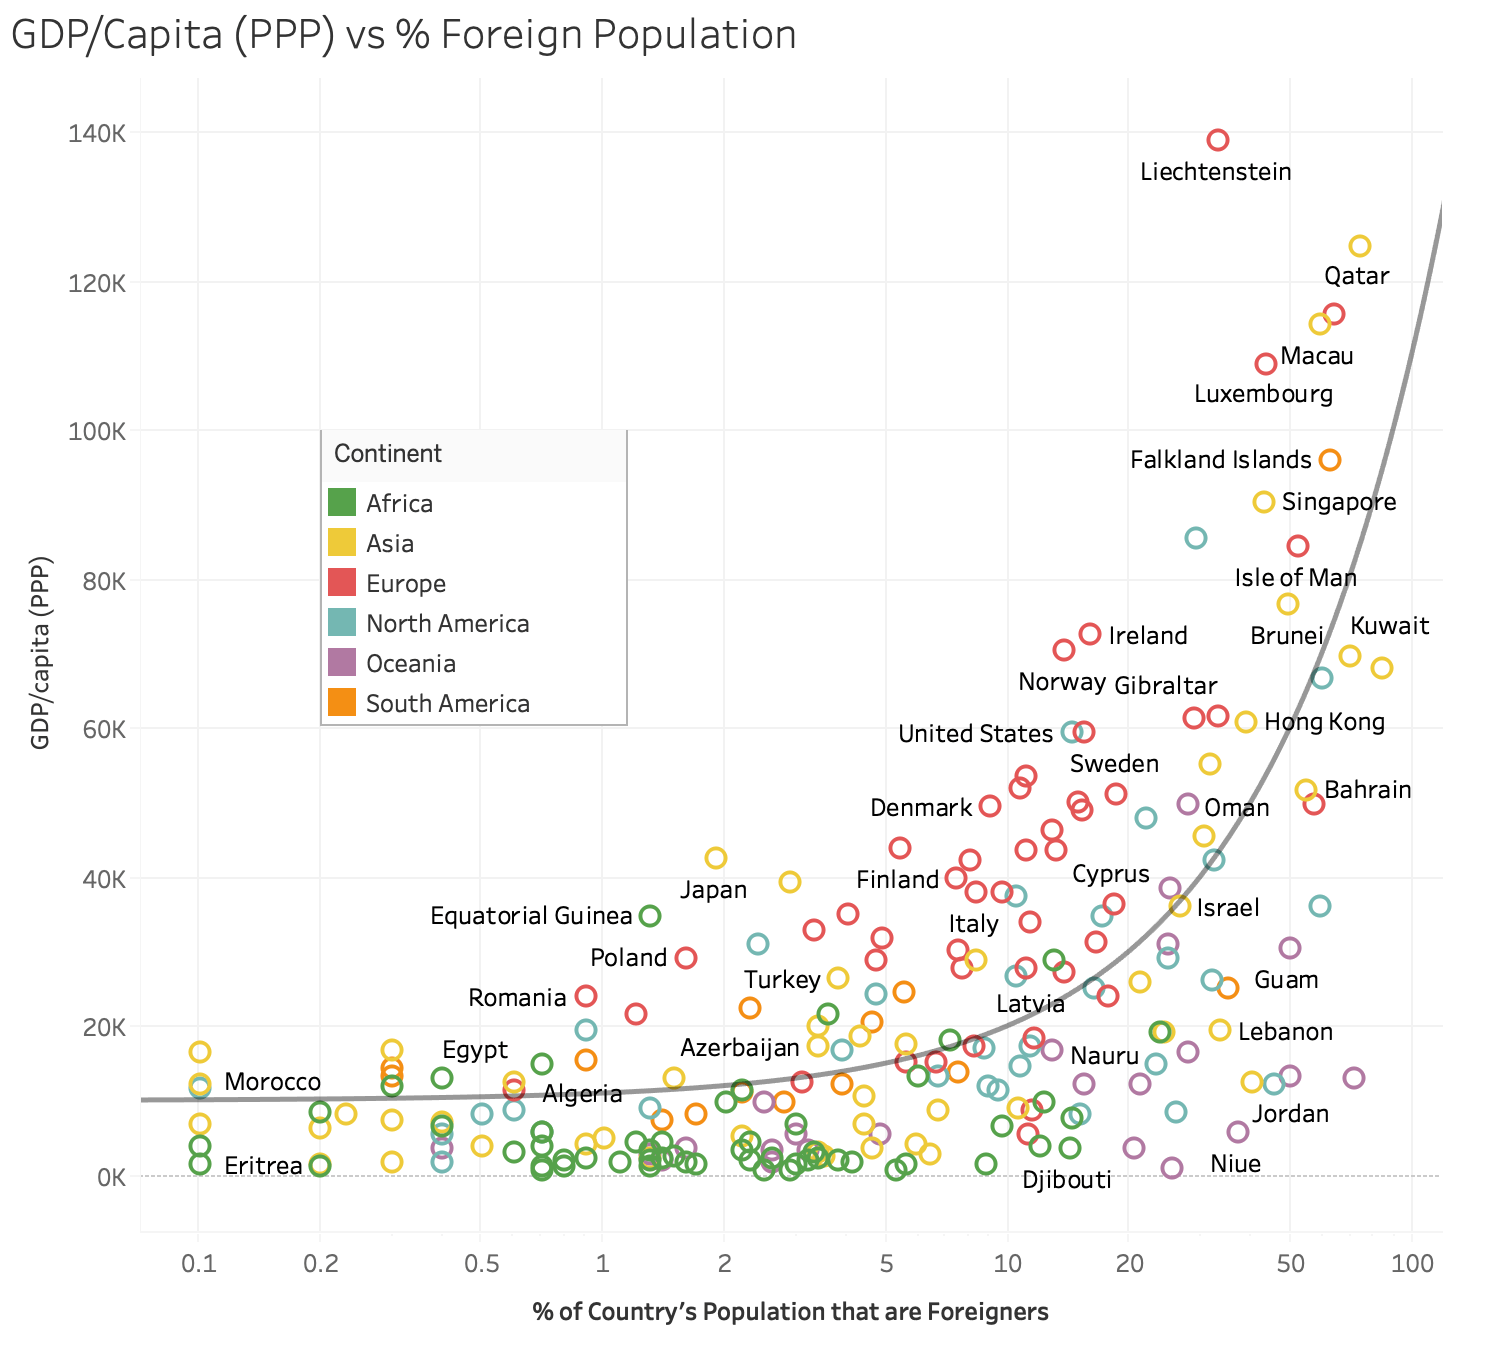
In addition to that, I have experience creating several visualisations in Tableau. Here is one visualisation I made regarding GDP vs Immigration levels:
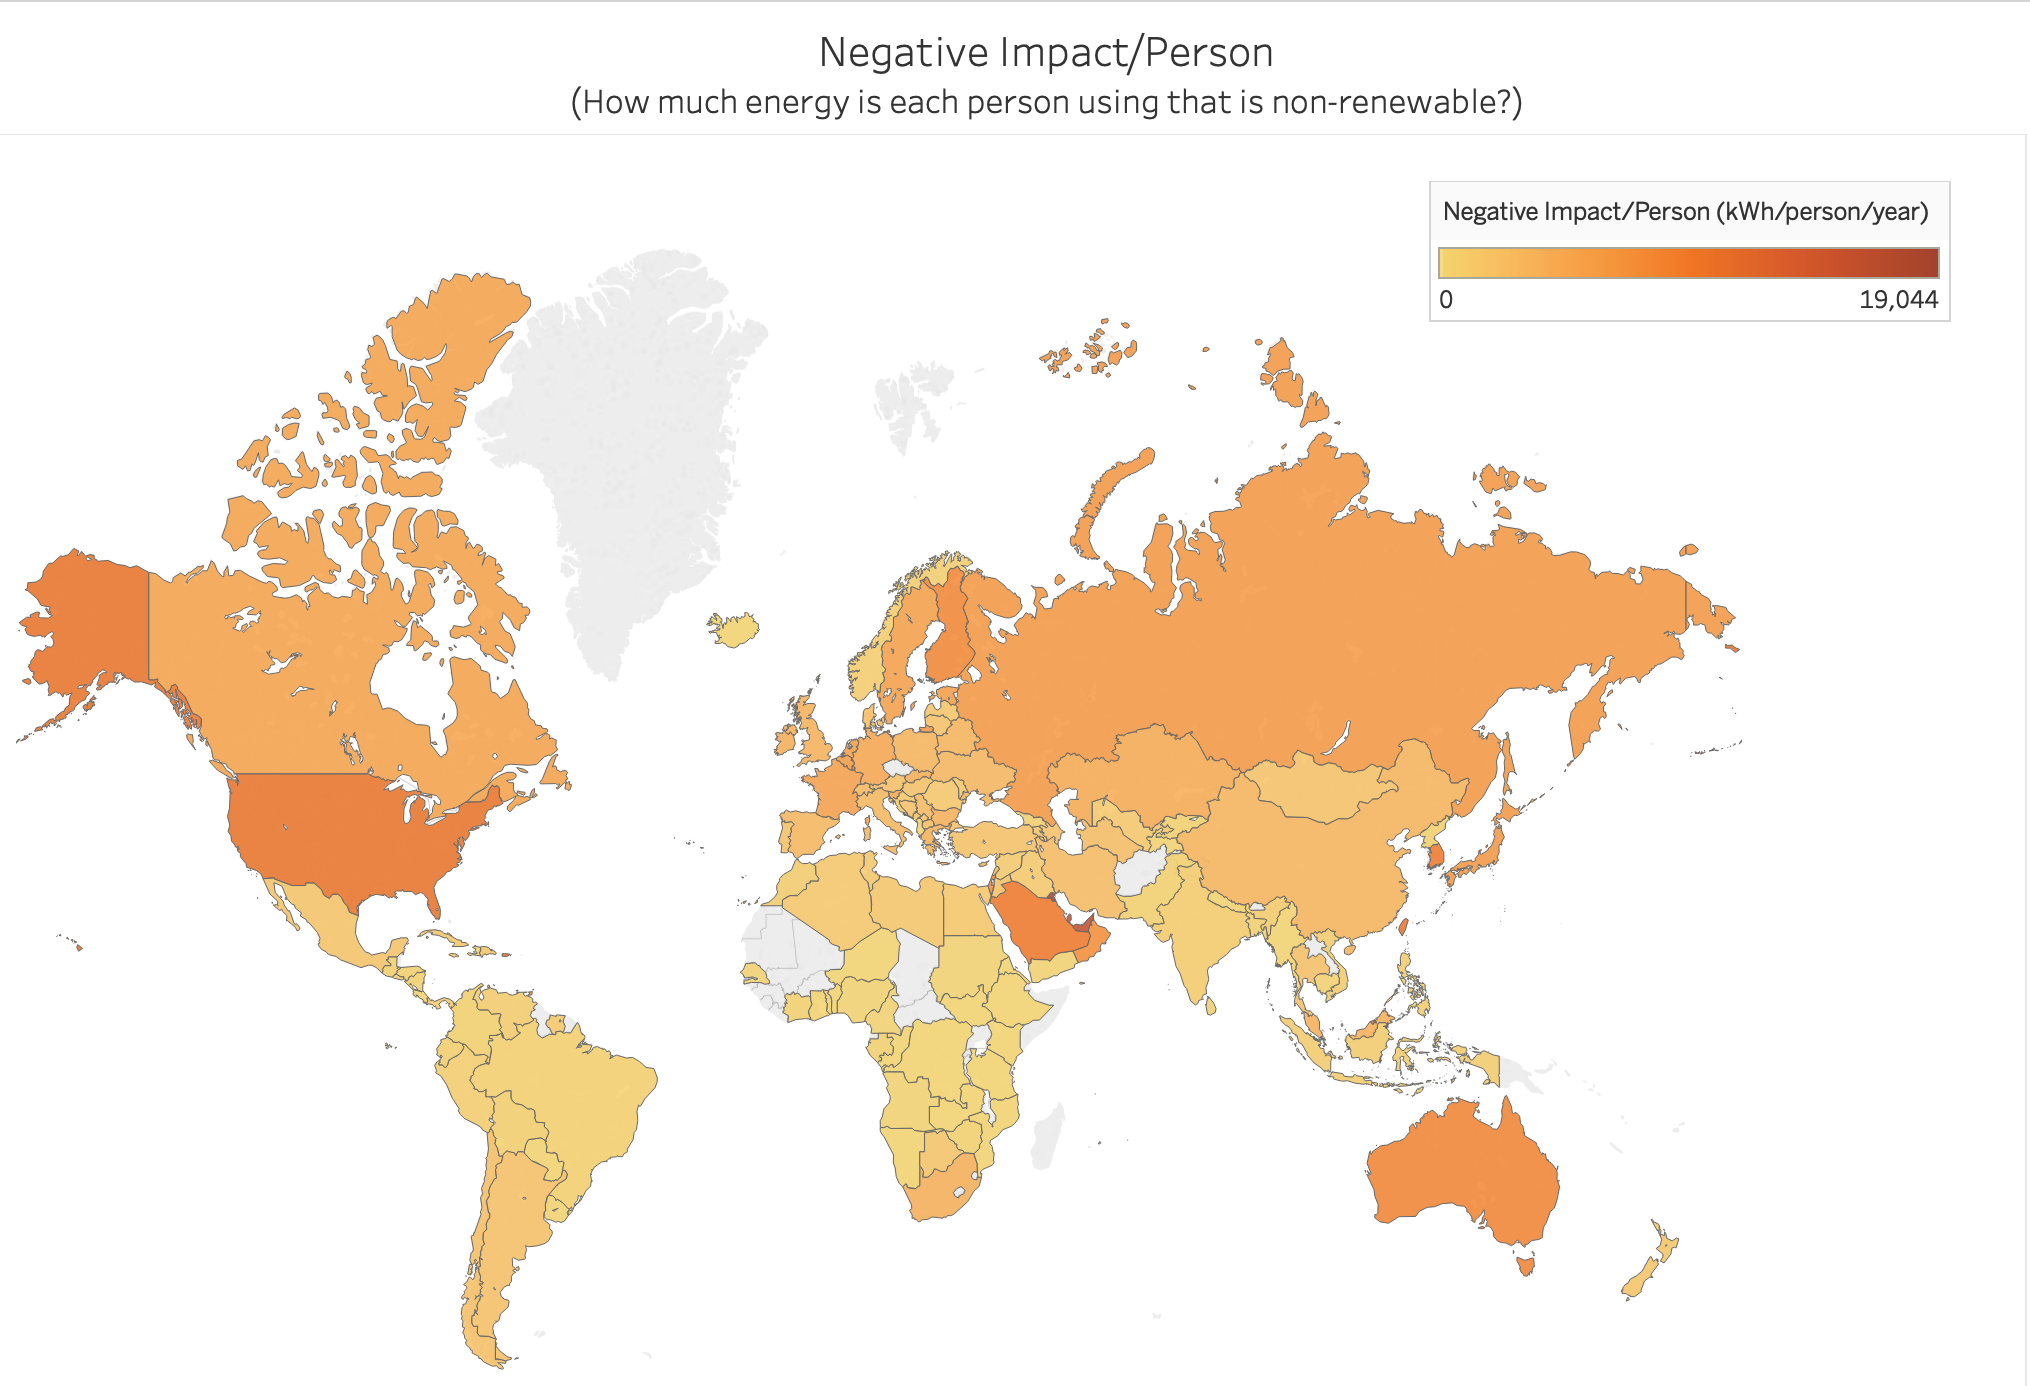
Here’s another visualisation which shows how much each person’s energy use comes from non-renewable sources:
To see my full Tableau portfolio, please click here.
